Journey analytics
This feature is available in Accelerator version 26.2.3. Contact your Customer Success Manager (CSM) for more information.
Overview
Journey analytics are available once a journey is set to Active. There are three places to view performance data: the Journey Metrics panel on the canvas, which provides a real-time and historical view of how members are moving through the journey; the Campaign Analytics tab, which provides a detailed, filterable breakdown of messaging performance across all activation tiles; and the Export History tab, which lists every export from the journey's Destination tiles.
Journey metrics panel
The Journey metrics panel is accessible directly on the journey canvas. It displays overview metrics for the full journey alongside tile-level metrics for each individual node.
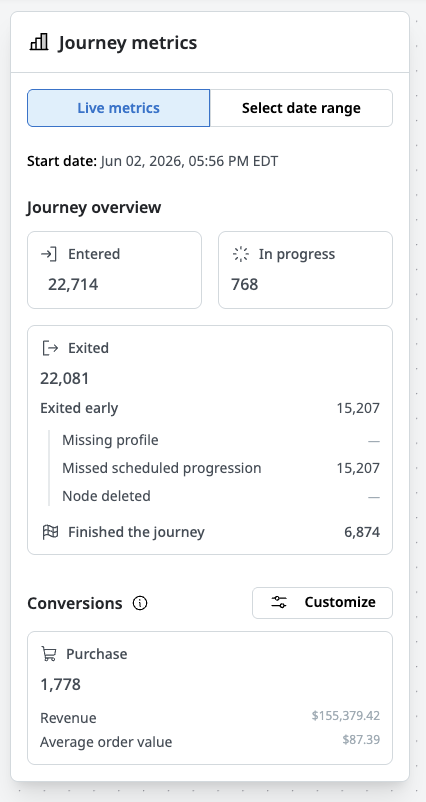
Select a timeframe
Use the timeframe selector at the top of the panel to control which data is displayed.
- Live metrics (journey start to now) — shows all metrics including In Progress counts for activation and delay tiles.
- Select date range — shows historical metrics for the selected window. In Progress is hidden from overview and delay tile metrics when a date range is selected.
Overview metrics
The Journey overview section shows high-level counts for the full journey across the selected timeframe.
| Metric | Description |
|---|---|
| Entered | The number of members who successfully entered the journey during the selected timeframe. |
| In Progress | The number of members currently moving through the journey at this point in time. Visible only when Live metrics is selected. |
| Exited | The total number of members who have left the journey, broken down by exit reason. |
Exit reason breakdown
Exited counts are broken down by the following reasons.
| Exit reason | Description |
|---|---|
| Finished the journey | The member reached the end of their journey path without triggering any other exit condition. |
| Exited early | The member left the journey before completing their path. Broken down further by the specific reason below. |
| Missing profile | A profile lookup was required during the member's progression, but no matching profile existed. |
| Missed scheduled progression | The system was unable to advance the member on their scheduled evaluation — for example, if evaluations were paused and a scheduled resume time was missed. |
| Node deleted | The member was waiting in a delay tile that was deleted while they were in it. |
Conversion tracking
The Journey metrics panel supports up to two configurable conversion events drawn from your Managed events. Purchase is selected by default.
When Purchase is selected, the panel surfaces three metrics: Revenue and Average order value alongside the Purchase count.
To configure conversion events, select Customize next to the Conversions heading and choose up to two events from the list.
Tile metrics
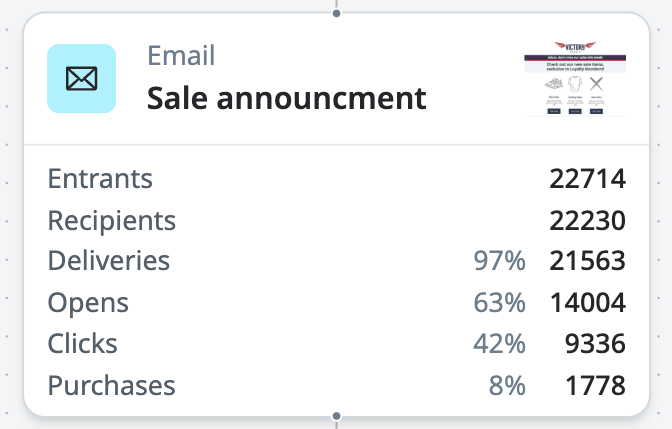
Each tile on the canvas displays metrics relevant to its type. Tile metrics reflect the selected timeframe.
Activation tiles (Email, Push, SMS)
| Metric | Description |
|---|---|
| Entrants | Members who reached this tile during the selected timeframe. |
| Recipients | Members for whom a send was attempted — meaning they reached the tile and had a valid channel identifier (email address, mobile device ID, or phone number). |
| Deliveries | Messages successfully delivered. |
| Unique opens | Individual members who opened the message at least once. |
| Clicks | Total clicks recorded on the message. |
| Conversions | Conversion events attributed to this tile, based on your configured conversion events. |
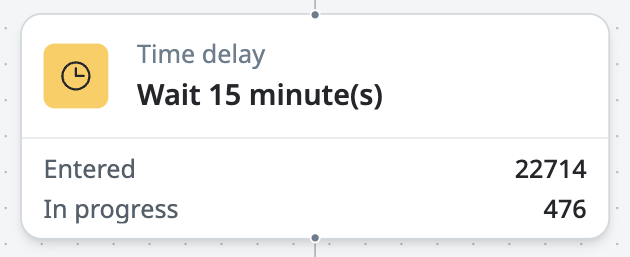
Time delay tiles
| Metric | Description |
|---|---|
| Entered | Members who entered this delay during the selected timeframe. |
| In Progress | Members currently waiting in this delay at this point in time. Visible only when Live metrics is selected. |
Segment split tiles
| Metric | Description |
|---|---|
| Percent | Percent of entering members who matched the split filter criteria. |
| Entered | Count of entering members who matched the split filter criteria. |

Destination tiles
| Metric | Description |
|---|---|
| Entrants | Members who reached this tile during the selected timeframe, across all of its destinations. |
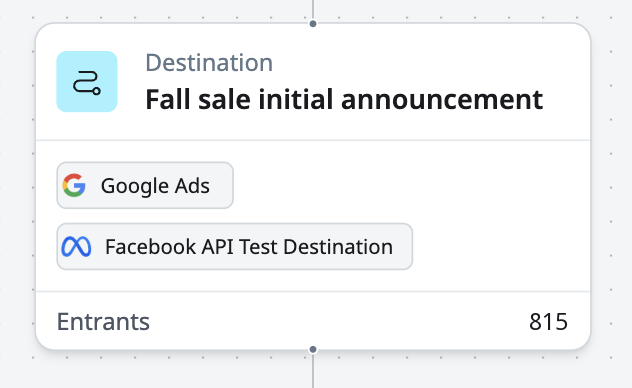
For the results of each export, see Export history tab.
Campaign analytics tab
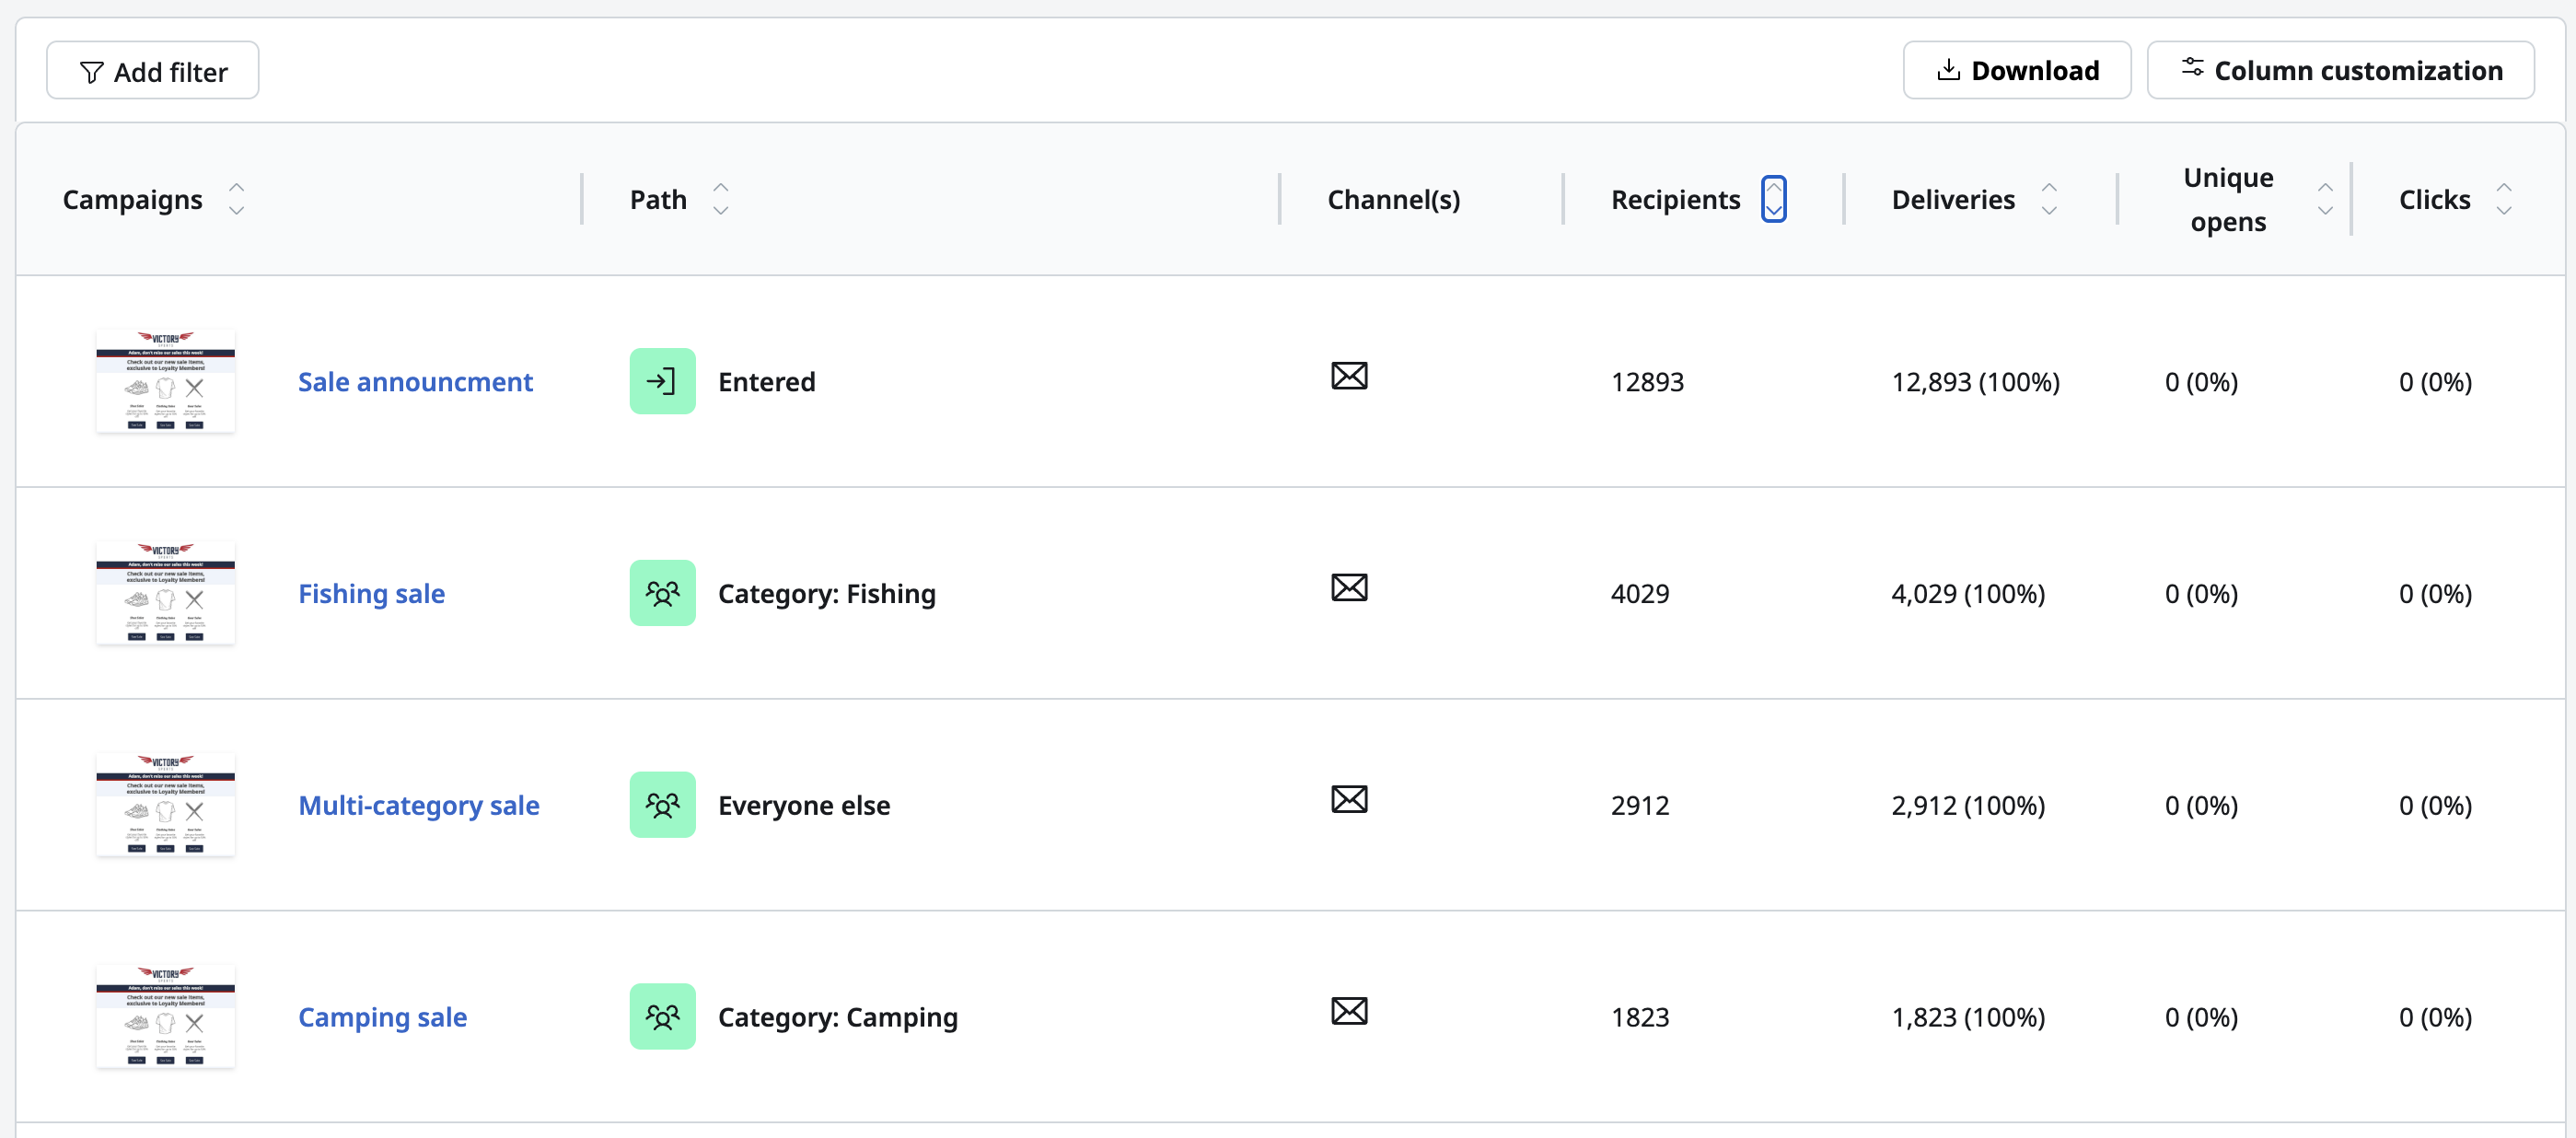
The Campaign analytics tab provides a detailed table of messaging performance across all activation tiles in the journey. Access it by selecting Campaign analytics on the journey canvas.
Filter and customize the view
Timeframe
Use the timeframe selector to filter the data shown. The available range spans from the journey's start date to today.
Channel filter
Filter the table by channel. The default view is Cross-channel, which shows all activation tiles regardless of channel. Select Email, Push, or SMS to narrow the table to tiles of that type.
Column customization
Select Columns to open the column picker and customize which metrics are shown. Columns are organized into groups.
| Group | Default columns | Available columns |
|---|---|---|
| — | Campaigns, Path, Channel(s) | — |
| Deliverability | Recipients, Deliveries | Suppressed, Bounce, Unsubscribe |
| Engagement | Unique opens, Clicks | Adjusted opens, Complaints, Content errors |
| Conversions | Purchases, Revenue, Avg. order value | — |
Understand the Path column
The Path column shows the segment lineage that led to each activation tile — in other words, which segments a member passed through before reaching that tile.
| Scenario | Path display |
|---|---|
| No segment tile precedes the activation tile | Entered |
| One or more segment tiles precede the tile | Segment labels listed in order from top to bottom (for example: Gold > Georgia > Atlanta) |
| A merge node precedes the tile | Merged paths separated with a + (for example: Gold > Georgia + Silver > California) |
The table is sorted by Path by default, following the topology of the canvas from top to bottom, then left to right. Rows with the path Entered appear first. You can sort by any column except Channel(s). Metric columns sort numerically; the Campaigns column sorts alphabetically.
Show deleted tiles
Activation tiles that have been deleted from the canvas are hidden from the table by default. Select Show deleted to include them. Deleted tiles display a deleted indicator and the date they were removed.
Export to CSV
Select Download to export the current table view as a CSV file. The export reflects the columns and filters active at the time of download. CSV columns include Tile name, Channels, and all selected metric columns.
Export history tab
The Export history tab is available in Accelerator version 26.3.3.
To confirm that your Destination tiles delivered their members, and to find out why an export failed, use the Export history tab. It lists every export from the journey's Destination tiles, with one row for each destination on each evaluation cycle. The tab appears once the journey is no longer a draft. For more information about configuring Destination tiles, see Journey tiles.
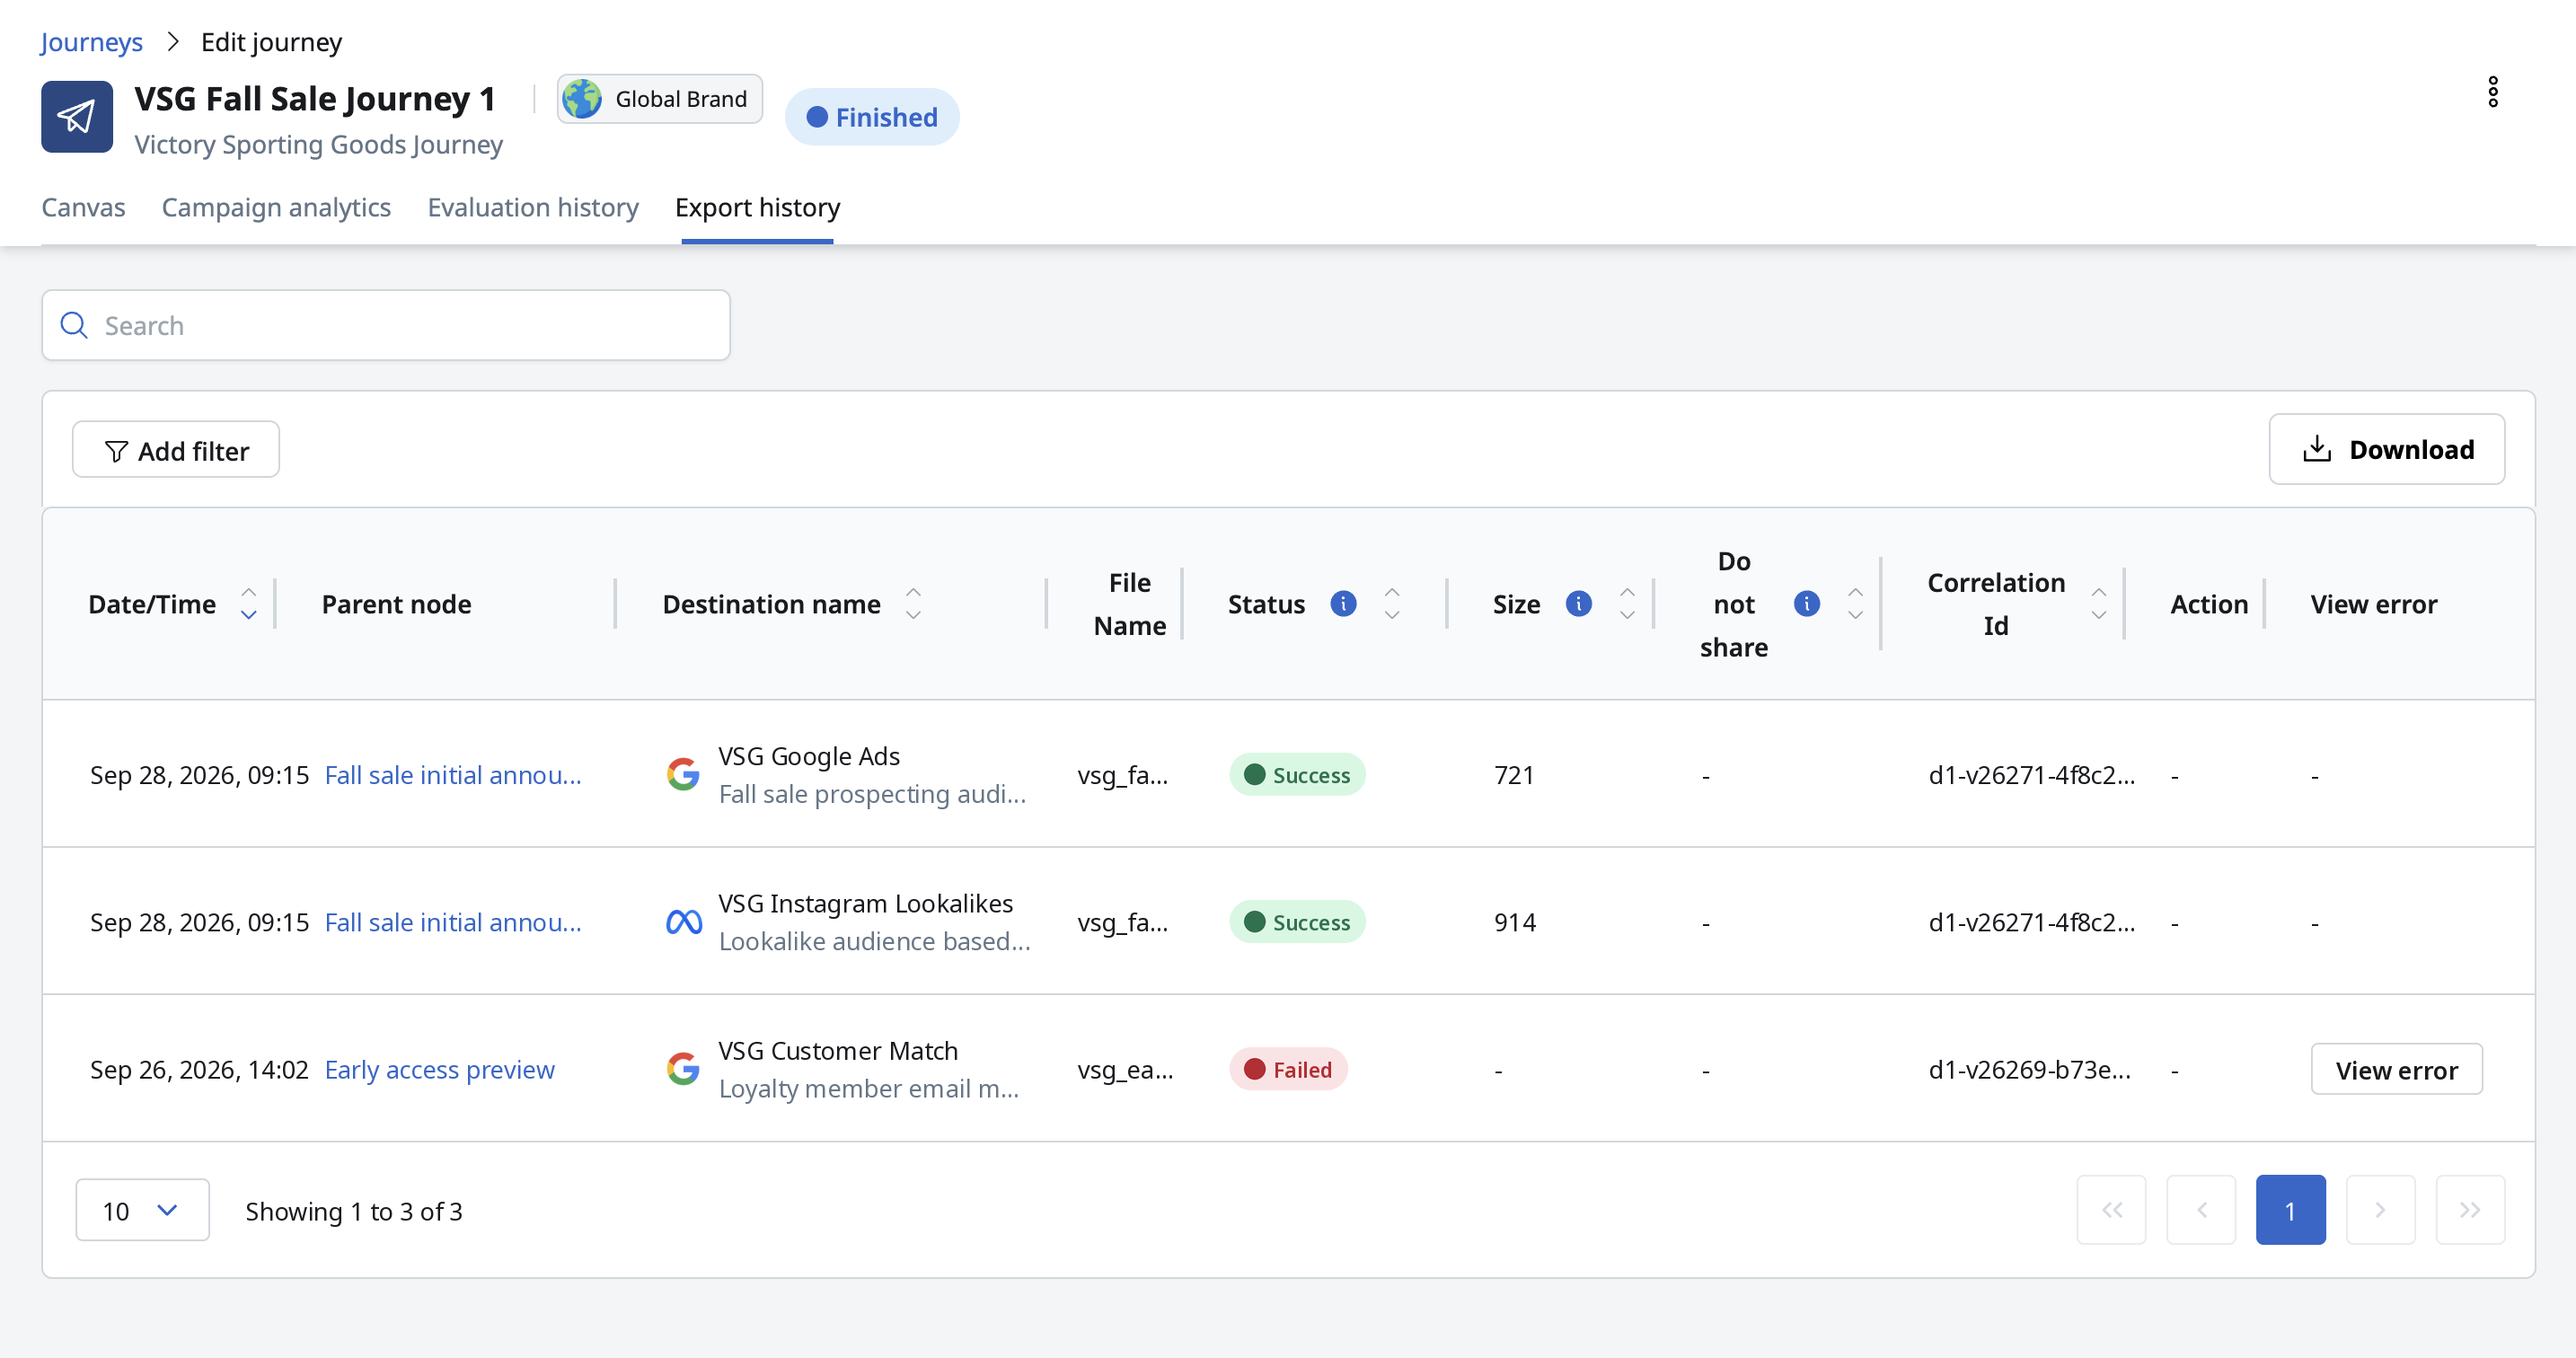
| Column | Description |
|---|---|
| Parent node | The name of the Destination tile that ran the export. |
| Destination name | The destination the members were exported to. |
| File name | The name of the exported file. Blank for destinations that don't deliver a file. |
| Status | Whether the export succeeded or failed. |
| Size | The number of members exported. |
| Do not share | Whether members flagged as do not share were excluded from the export. |
| Correlation ID | The identifier for the export job. Include it when you contact support about an export. |
| Action | For Meta Custom Audience destinations, whether members were added to or removed from the audience. Blank for other destinations. |
| Date | When the export ran. |
Filter, search, and sort
To narrow the table, use the filters for Status, Date range, Destination, and Parent node.
To find a specific export, enter a Destination tile name, destination name, correlation ID, or action in the search field.
To sort the table, select a column heading. You can sort by parent node, destination name, and action.
View an export error
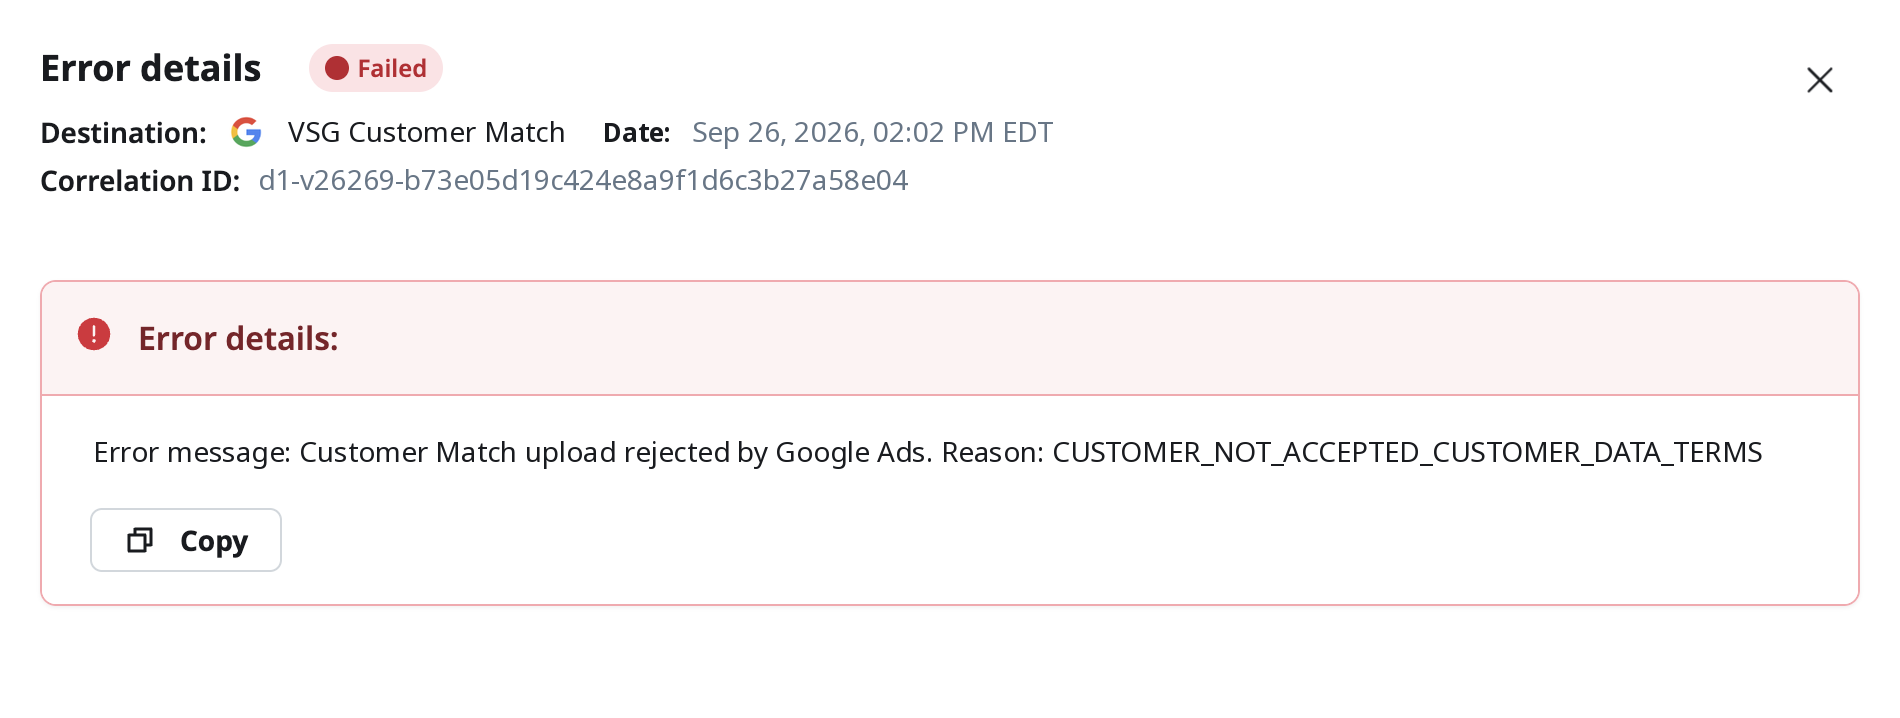
If an export fails, select View error on its row. The Error details panel shows the destination, the date, the correlation ID, and the error message. To copy the error message, for example to share it with support, select Copy.

Download export history
Select Download to export the table as a CSV file. The file includes only the rows that match your current filters and search.
Campaign analytics metric definitions
The following metrics are available in the Campaign Analytics tab.
| Metric | Group | Description |
|---|---|---|
| Recipients | Deliverability | Members who reached the tile and had a valid channel identifier, making a send attempt possible. Members missing a valid identifier are counted as Content errors and are not included in Recipients. |
| Deliveries | Deliverability | Messages successfully accepted for delivery by the receiving server or platform. |
| Suppressed | Deliverability | Members excluded from the send because they matched an active suppression rule. |
| Bounce | Deliverability | Messages that could not be delivered and were returned by the receiving server. |
| Unsubscribe | Deliverability | Members who unsubscribed in response to this message. |
| Adjusted opens | Engagement | Opens adjusted to account for automated open activity, such as Apple Mail Privacy Protection. |
| Unique opens | Engagement | Individual members who opened the message at least once. |
| Clicks | Engagement | Total clicks recorded on links within the message. |
| Complaints | Engagement | Members who marked the message as spam or junk. |
| Content errors | Engagement | Members who reached the tile but could not receive a message due to a missing channel identifier (for example, no email address or phone number). These members are advanced to the next tile. |
| Purchases | Conversions | Conversion events of type Purchase attributed to this tile. |
| Revenue | Conversions | Total revenue attributed to Purchase conversion events for this tile. |
| Avg. order value | Conversions | Average revenue per Purchase conversion event for this tile. |
Conversion metrics for Purchases, Revenue, and Avg. order value appear only when Purchase is selected as a conversion event in the Journey Metrics panel. You can configure up to two conversion events from your Managed Events.