Performance dashboard
The Dashboard provides a centralized view into message performance and execution across Accelerator. It brings together high-level metrics, conversion insights, and operational visibility, allowing teams to quickly assess how campaigns are performing and how jobs are running—without navigating into individual assets.
The Dashboard is organized into two primary areas: Performance and Operational, each designed for a distinct but complementary purpose.
Performance dashboard
The Performance dashboard focuses on understanding how messaging is performing across channels and campaigns. It surfaces delivery, engagement, and conversion insights, and provides quick access to recently used assets to help teams move seamlessly from analysis to action.
Within the Performance Dashboard, metrics can be filtered by account and time range, making it easy to analyze trends at both a high level and within a specific scope. Detailed views are organized into dedicated tabs for Overview, Conversions, and Notifications.
Overview tab
The Overview tab on the Performance Dashboard provides a high-level snapshot of message delivery activity and quick access to your most recently used assets. It's designed to help you understand delivery trends at a glance and jump back into active work without leaving the Dashboard.
Recipient metrics
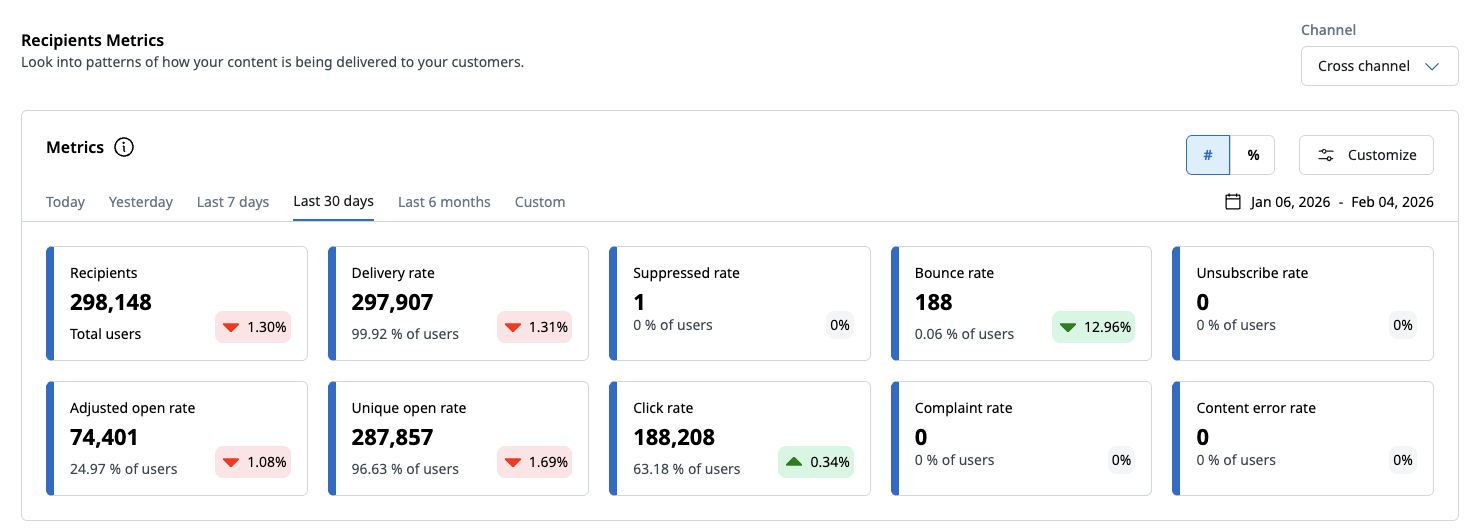
The Recipient metrics section shows delivery-level metrics over time, helping you understand how messages are being sent and processed.
You can control which metrics appear in the graphs using the Customize control.
Available metric categories include:
- Deliverability
- Recipients
- Deliveries
- Suppressed
- Unsubscribe
- Bounces
- Engagement
- Adjusted opens
- Unique opens
- Clicks
- Complaints
- Content errors
- Unique clicks
Select or deselect metrics to focus the graph on the data most relevant to your analysis. Changes apply immediately and do not affect underlying data.
To view metrics for a single channel, select it in the channel filter. The available metrics depend on the channel.
Performance over time
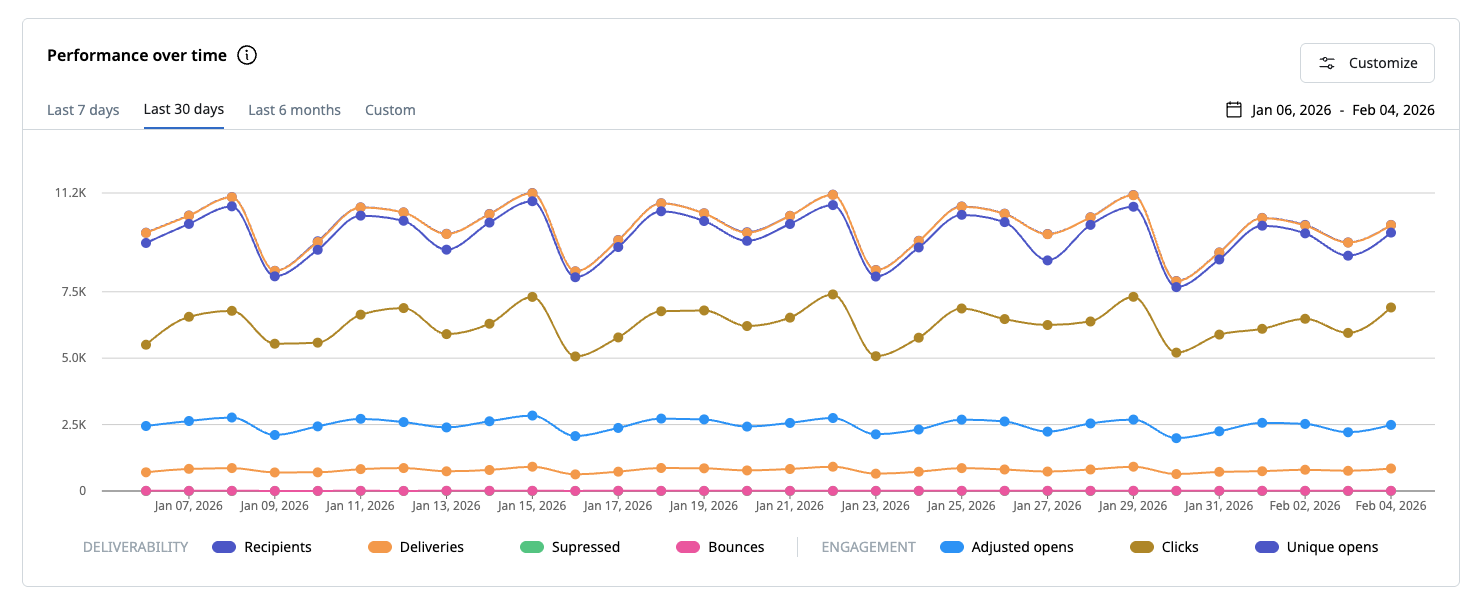
The Performance over time chart visualizes selected metrics across the chosen time window.
- Each metric is plotted independently, allowing you to compare trends
- Hover over the chart to see exact values by date
- Use customization controls to reduce visual noise and isolate specific signals
This view is especially useful for spotting:
- Delivery fluctuations
- Sudden increases in suppression or bounces
- Gaps in activity across time
Recently viewed assets
The Recently viewed section provides quick access to assets you've recently worked on across Accelerator.
Supported asset types include:
- Audiences
- Blueprints
- Templates
- Marketing campaigns
- Experiments
- Transactional campaigns
- External campaigns
Each row shows:
- Asset name
- Folder location
- Last modified date
- Last editor
Templates, marketing campaigns, and transactional campaigns that include Inbox content display the Inbox channel icon.
Conversions tab
The Conversions report provides insight into how your messaging campaigns drive meaningful user actions and business outcomes. It connects downstream behavior—such as custom events and purchases—back to messages sent through MessageGears, allowing teams to measure impact beyond opens and clicks.
This tab surfaces both aggregate conversion trends and campaign-level attribution, giving marketers and analysts a unified, cross-channel view of performance.
Conversion reporting overview
Conversion reporting attributes user actions to campaigns based on engagement with MessageGears messages. Once events are configured and syncing, conversions are automatically calculated and surfaced—no changes to campaign setup are required.
Key characteristics:
- Cross-channel attribution (Email, Push, SMS, In-app, Embedded)
- Support for both custom events and purchase events
- Unified reporting across accounts and channels
- Configurable attribution windows (managed by your Customer Success Manager)
Conversion metrics
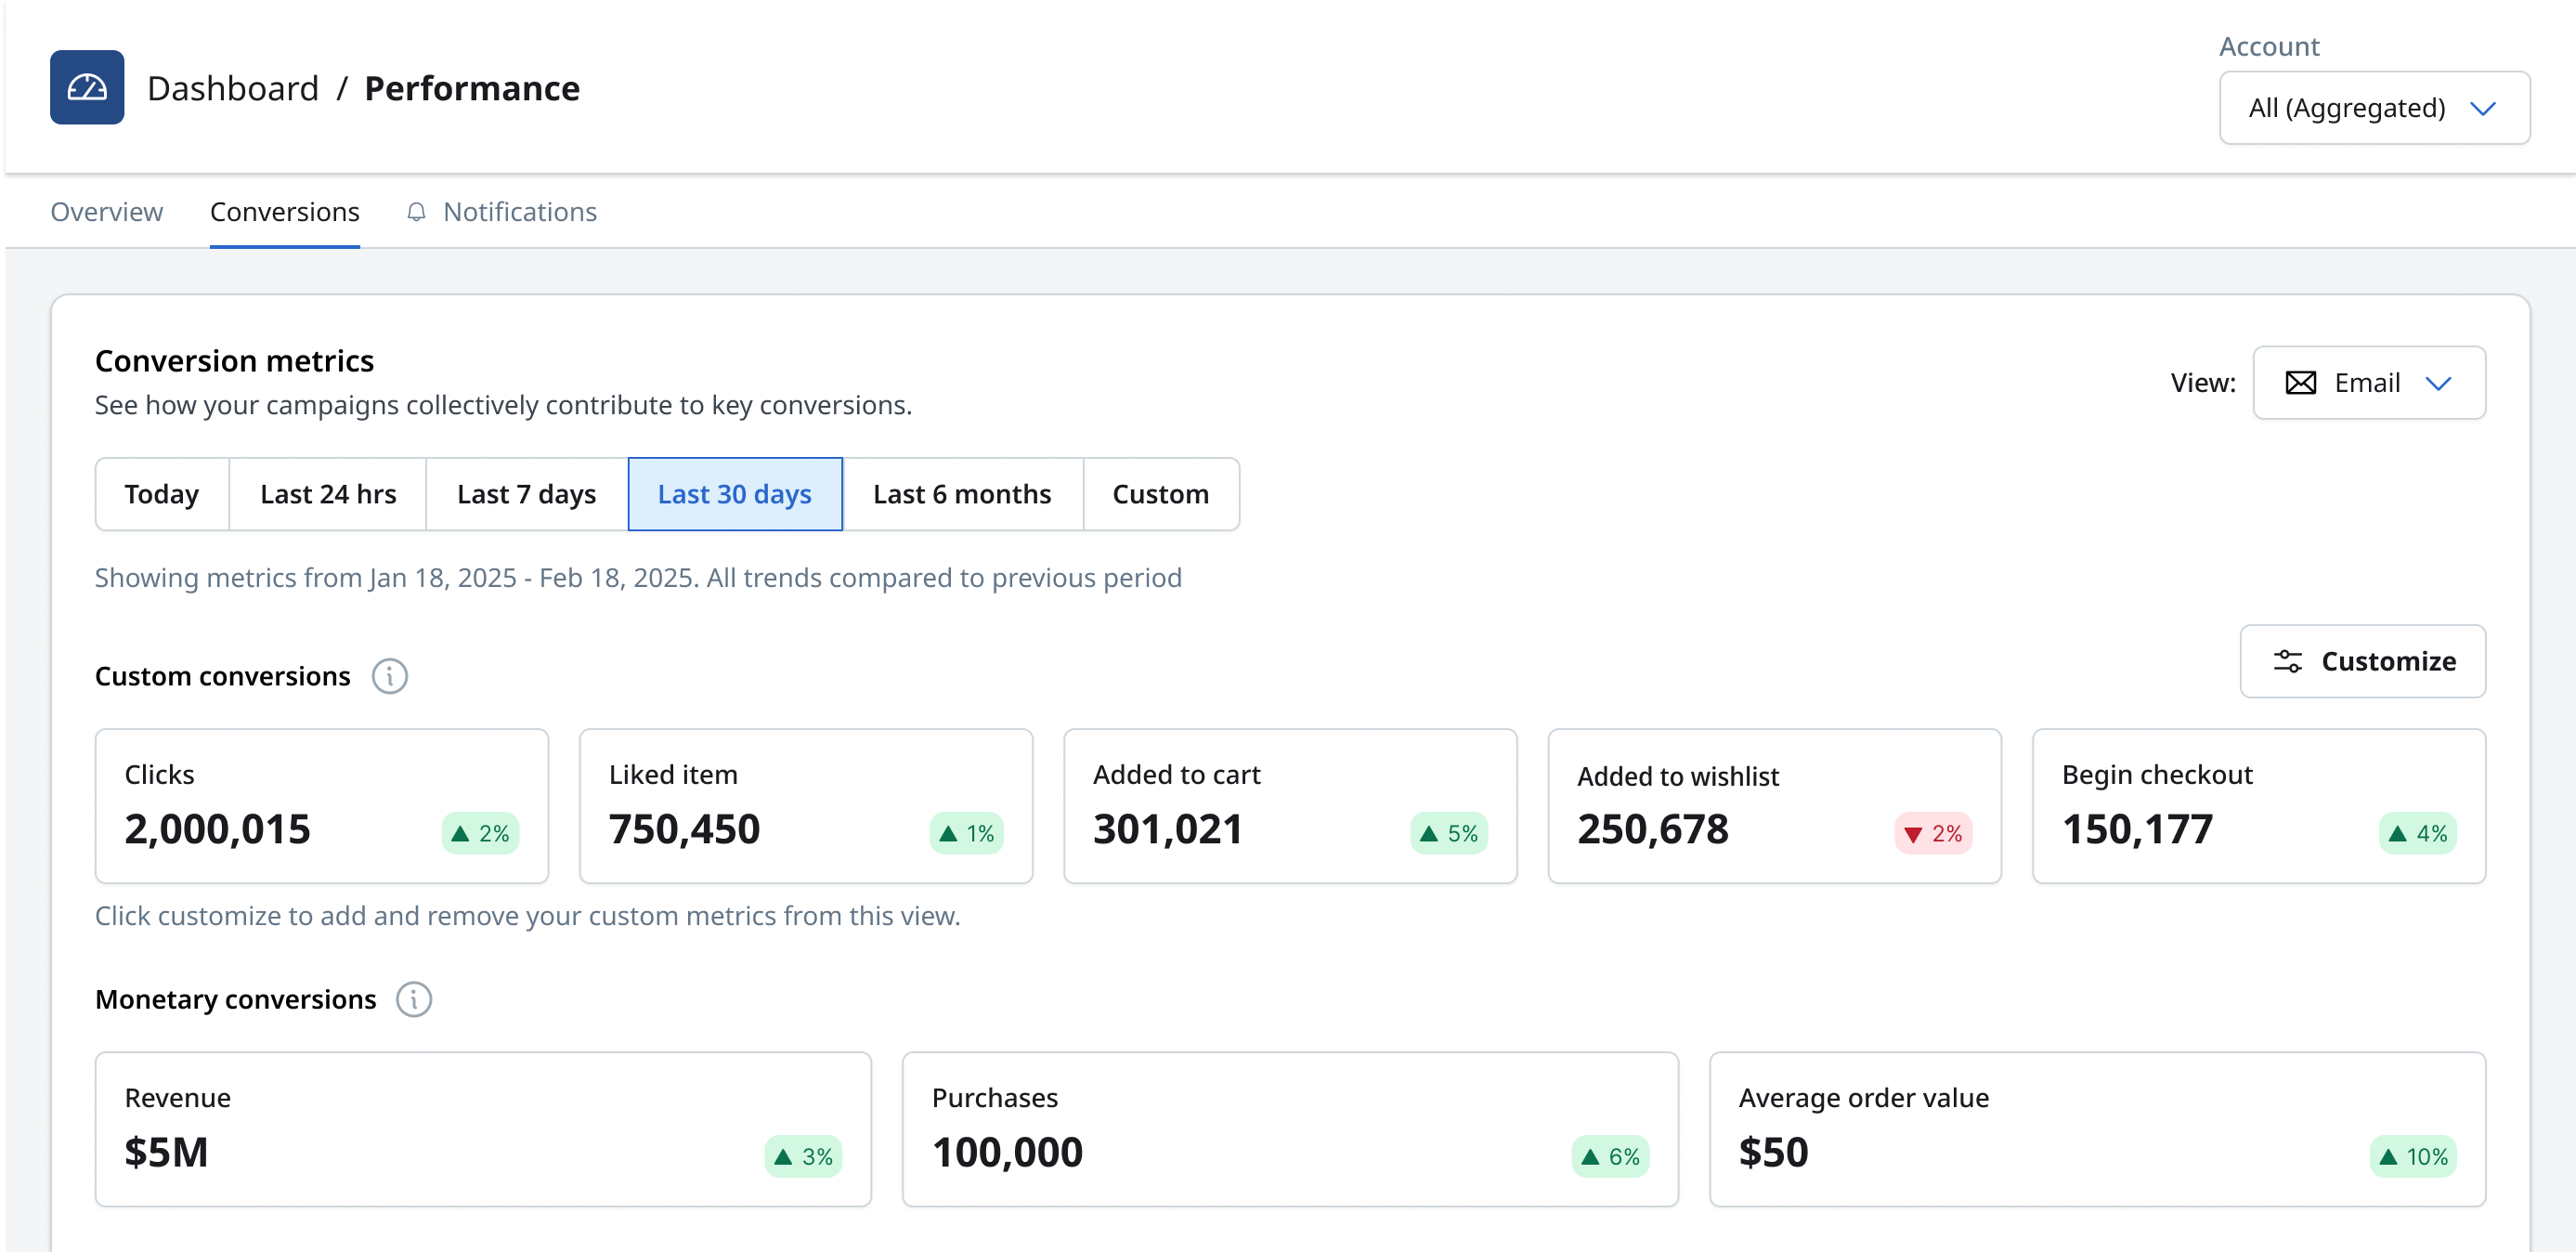
The Conversion metrics section provides an aggregate view of how messaging influences user behavior and how MessageGears campaigns drive both user actions and revenue.
Metric cards display totals for the selected timeframe and filters, and include both:
- Event-based metrics – Counts of campaign-attributed conversion events
- Monetary metrics – Purchases, Revenue, and Average Order Value (AOV), when purchase events are available
All metrics reflect only events that are:
- Enabled in Managed events
- Attributed to campaigns based on the configured attribution windows
Customizing metrics
Report viewers can control which metrics appear by selecting the conversion events that matter most to their goals.
- Custom events and purchase events can be viewed together
- Metric cards update immediately based on selections
- This allows teams to focus on specific behaviors or outcomes without changing underlying data
Filters
Use the filters at the top of the report to refine results. All filters apply consistently across charts and tables.
- Account – View conversions attributed to campaigns under a specific account
- Channel – Limit conversions to those attributed via a specific channel (e.g. Email, Push). Inbox isn't available in this filter.
- Timeframe – Show only conversions that occurred during the selected time range
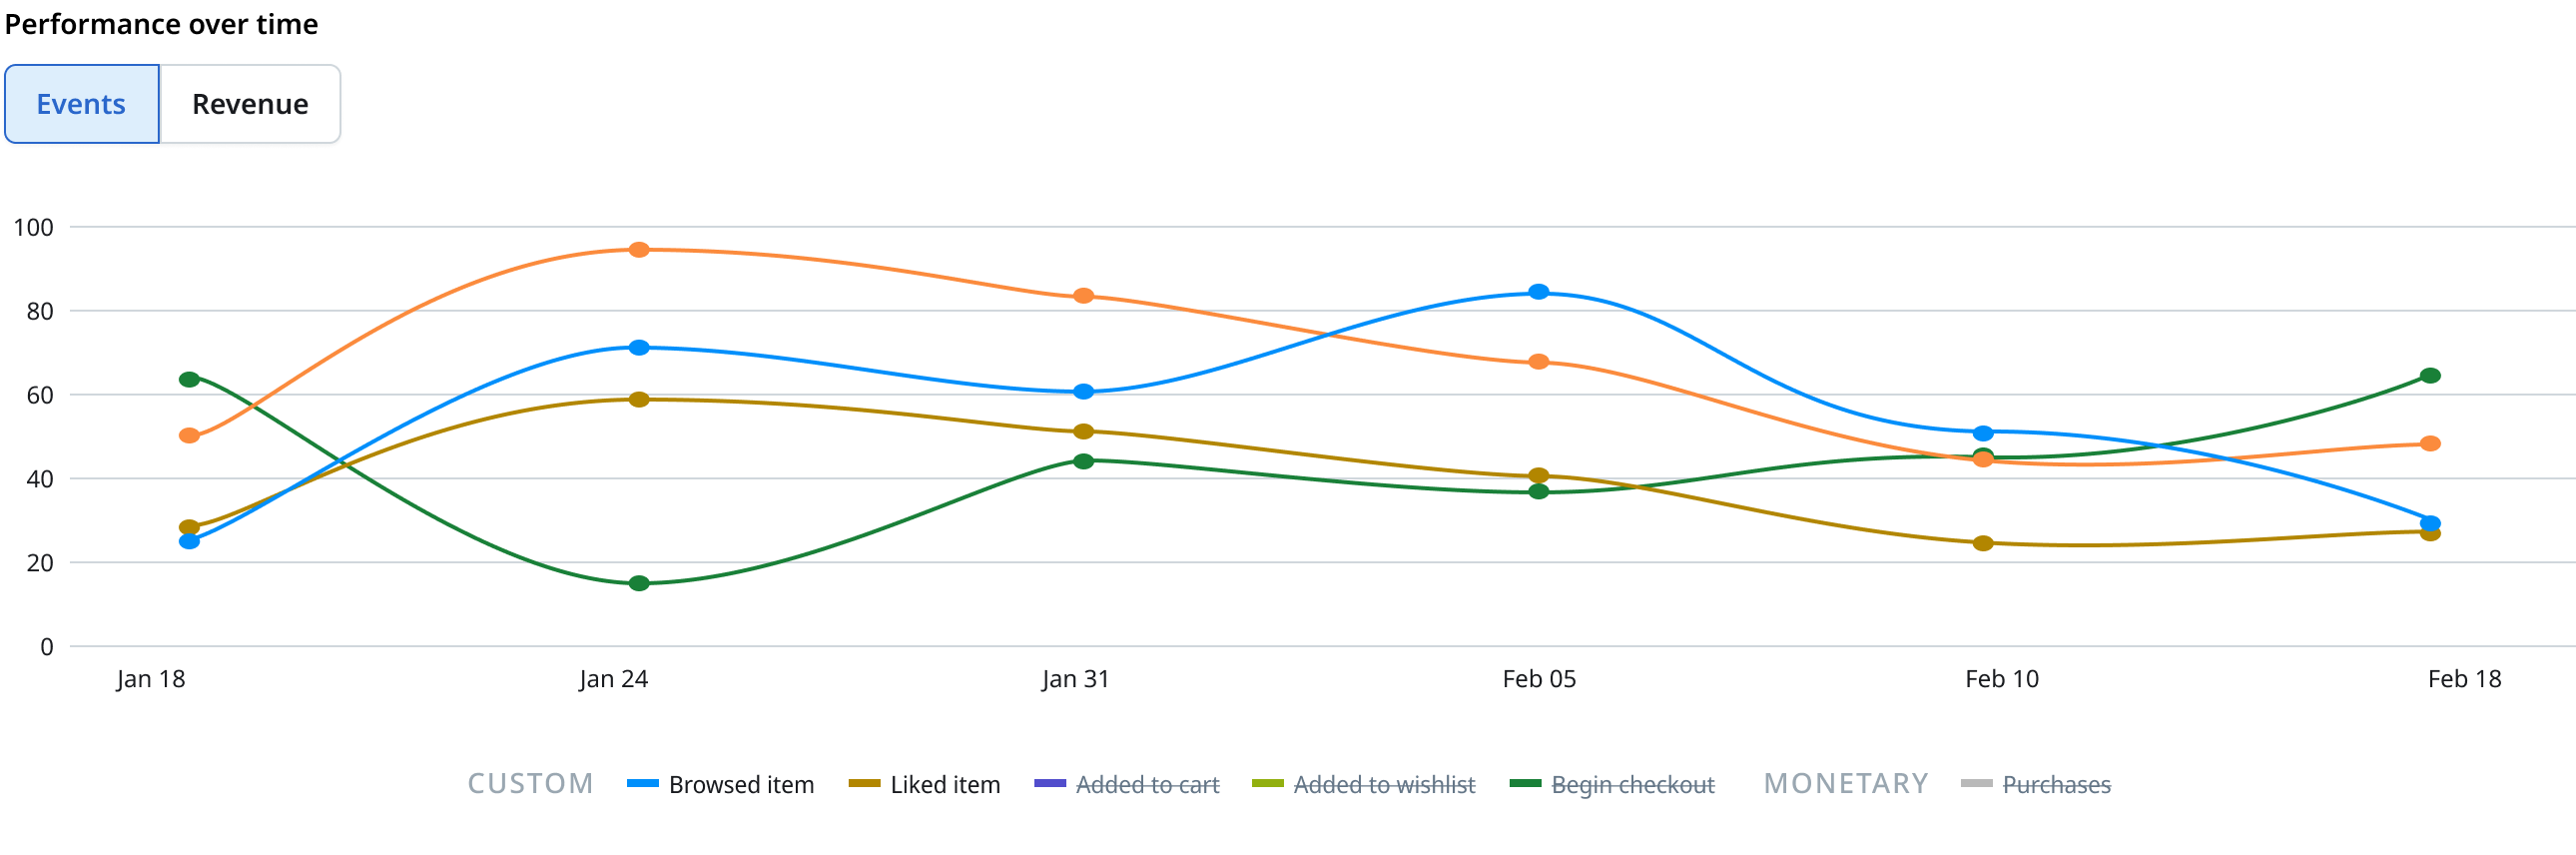
Performance over time (Conversions)
The Performance over time chart visualizes conversion activity across the selected timeframe.
- Track whether conversion volume is increasing or declining
- Compare trends across different conversion events
- Hover to view precise counts for specific dates
The chart supports two modes:
- Events
- Displays counts of all campaign-attributed events, including purchase events
- Useful for understanding overall conversion volume and behavioral trends
- Helps identify increases, declines, or irregularities in user actions over time
- Revenue
- Displays campaign-attributed Revenue over time
- Includes Average Order Value (AOV), calculated as Revenue divided by Purchases
- The Y-axis reflects monetary values, making it easier to assess financial impact
Use this view to understand how messaging performance translates into revenue and whether monetization is trending in the right direction.
Campaign analytics table
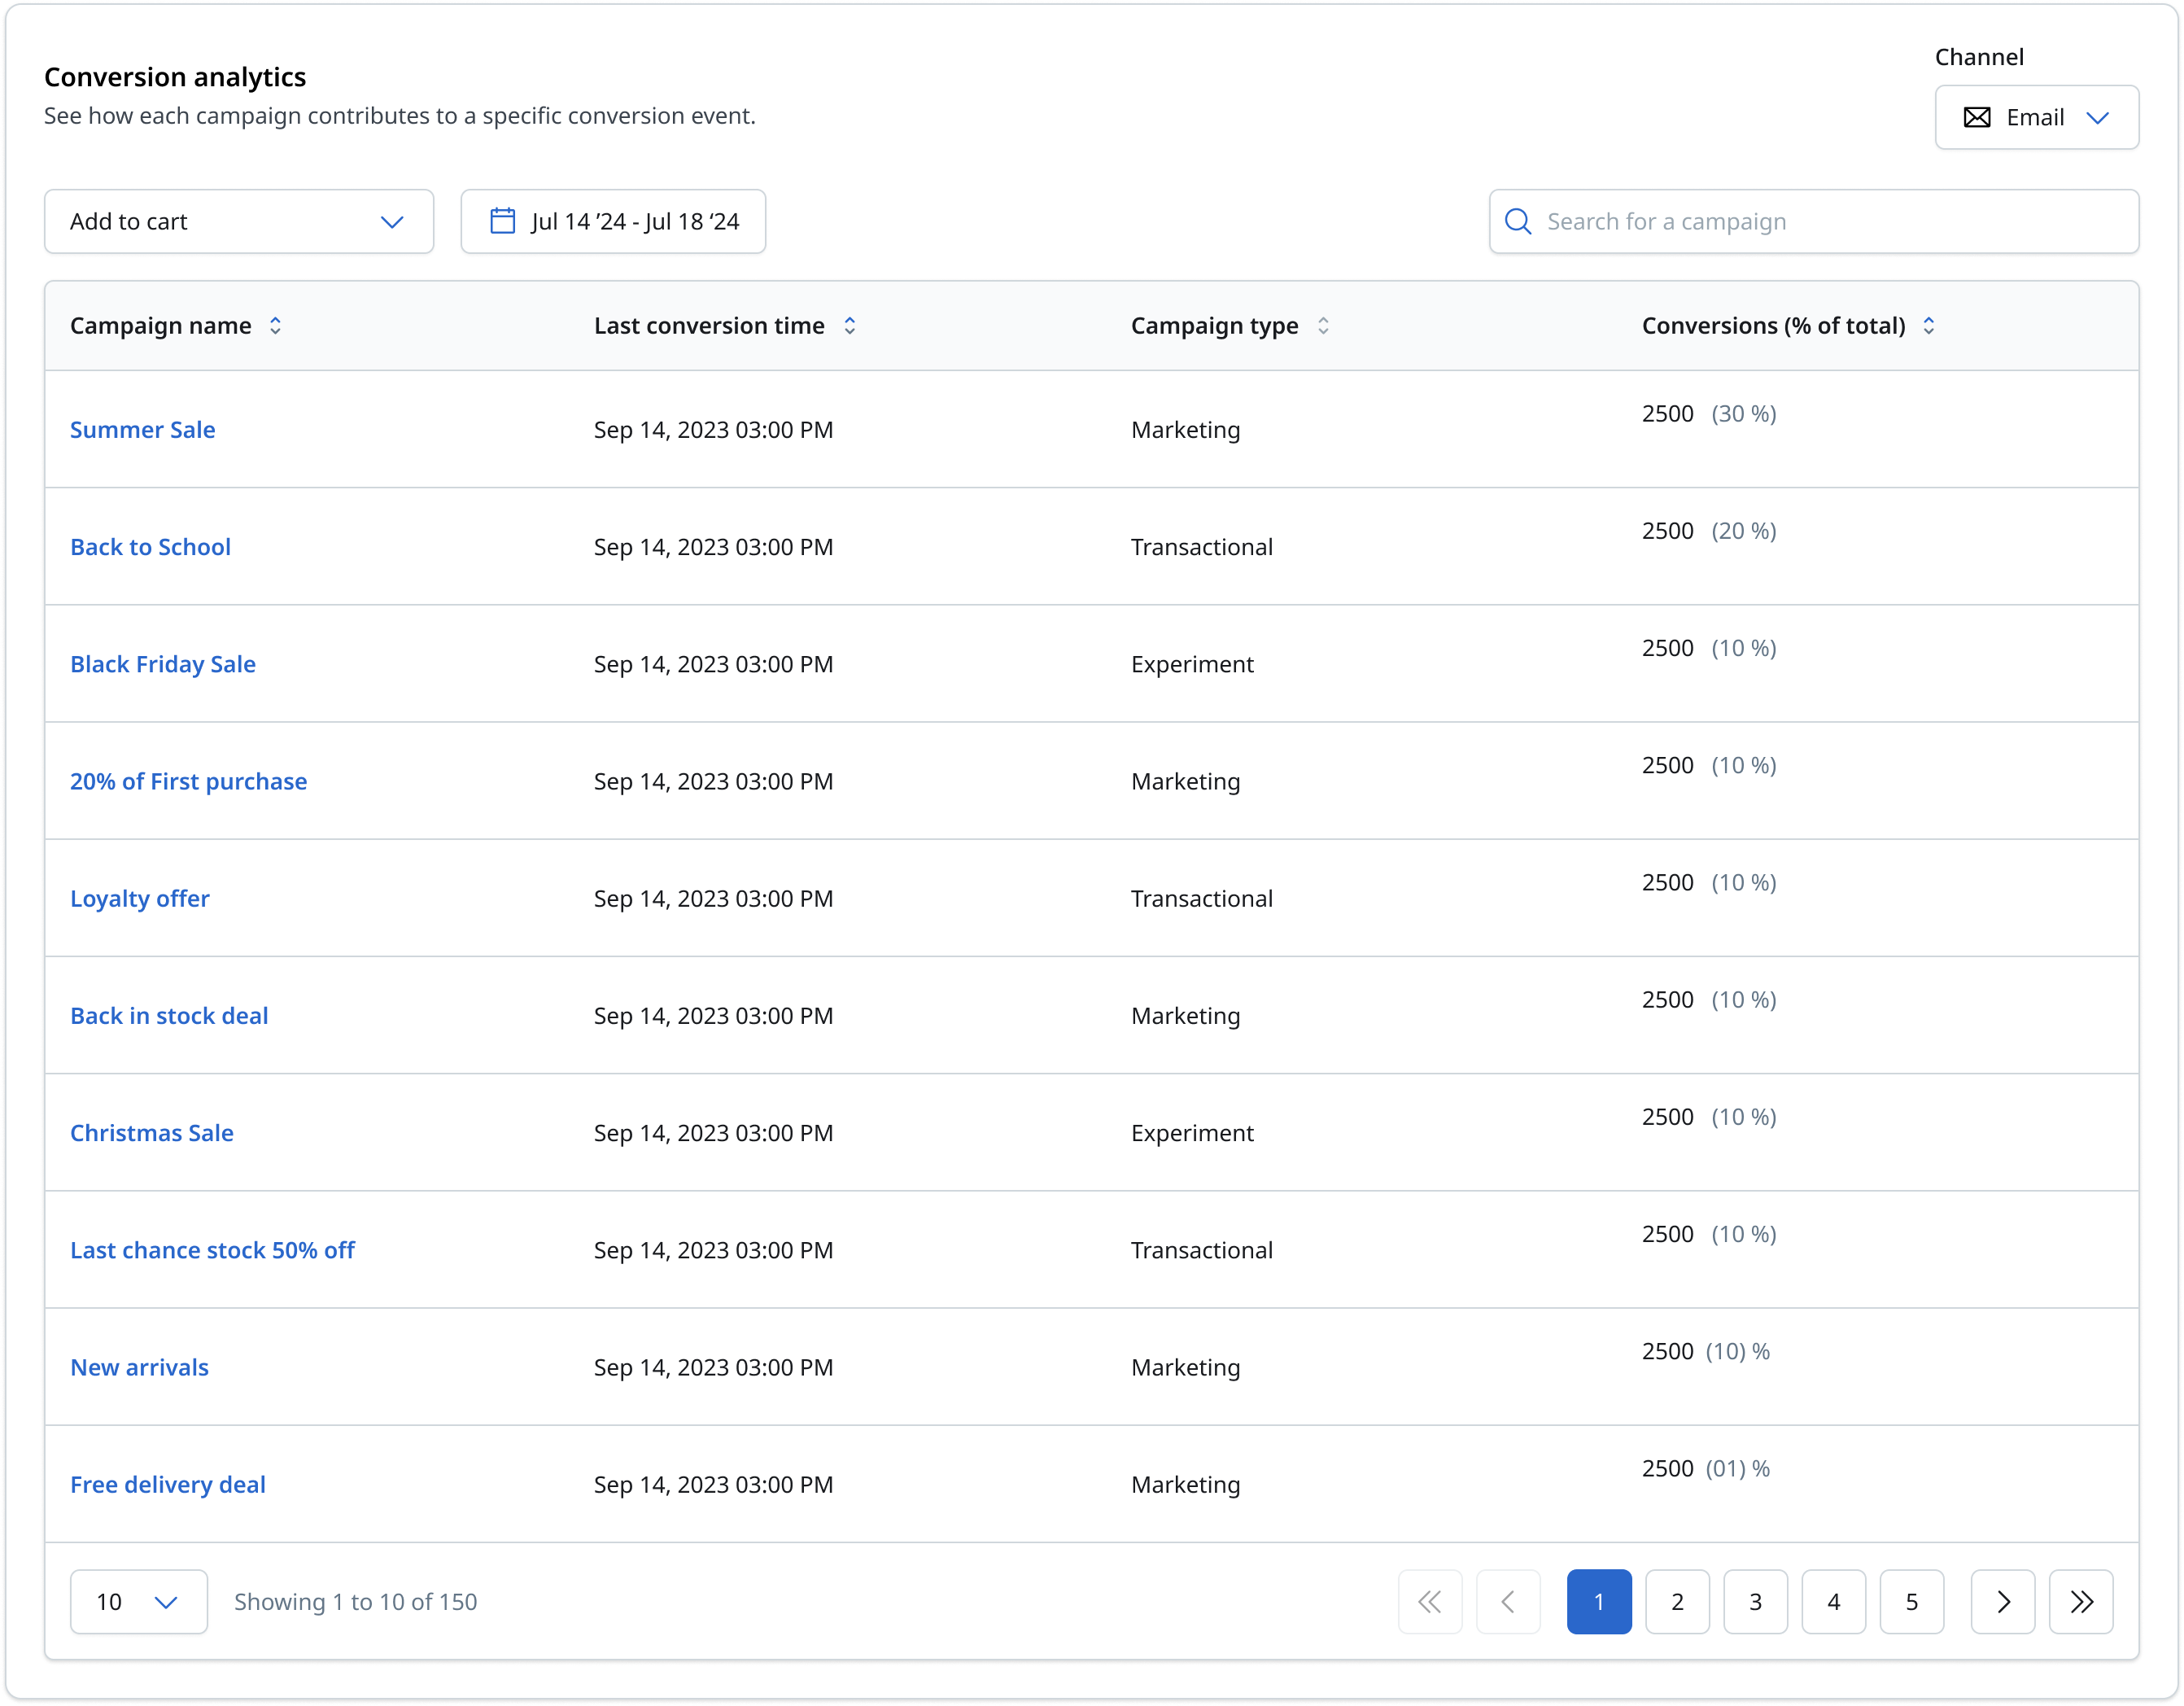
The Conversion analytics table breaks down how individual campaigns contribute to both conversion events and revenue, making it easy to compare campaign effectiveness side by side.
Each row represents a campaign and reflects only conversions that have been attributed to that campaign based on the selected filters and attribution settings.
Event selection
Use the conversion event selector to control which events are reflected in the table.
- Custom events and purchase events can be selected
- Selecting the dedicated Purchase event enables monetary columns
- Multiple events can be analyzed together for broader insight
Table columns
Depending on the selected conversion events, the table may include:
-
Event-based metrics
- Conversions – Total number of conversion events attributed to the campaign
- % of Total Conversions – The campaign's share of all attributed conversions
-
Monetary metrics (Purchase events) - When purchase events are selected, additional columns appear:
- Purchases – Number of attributed purchase events
- Revenue – Total attributed revenue
- Average order value (AOV) – Revenue divided by purchases
Exporting campaign conversion data
Campaign conversion results can be downloaded as a CSV for offline analysis or sharing.
- The exported file includes all columns and values currently visible in the table
- The filename includes the event name for reference (for example,
Purchase_CampaignConversionMetrics.csv)
When to use the campaign conversion table
The campaign table is ideal for:
- Comparing conversion and revenue performance across campaigns
- Identifying top-performing and underperforming campaigns
- Validating which messages drive outcomes, not just engagement
- Exporting data for deeper analysis or reporting
How conversions are attributed to campaigns
MessageGears attributes conversion events to campaigns based on user engagement with messages sent through the platform.
Attribution windows
- Attribution windows define how long after a message interaction a conversion can be attributed
- Windows are configured per channel
- All channels default to a 24-hour attribution window
- Attribution windows are managed by your Customer Success Manager (CSM)
Attribution windows apply to future calculations and should be configured before enabling event ingestion.
Attribution model
- Conversions are attributed using a last-clicked attribution model
- The most recent eligible message interaction determines which campaign receives credit
- Attribution is evaluated independently per channel (Email, Push, SMS, In-app, Embedded)
Only events that occur within the configured attribution window are eligible for attribution.
How revenue is calculated
When purchase events are ingested, MessageGears calculates revenue at the event level and attributes it to campaigns using the same attribution logic described above.
Revenue is calculated using the following purchase event fields:
Revenue = Cost × Quantity
- Cost – Price per unit
- Quantity – Number of units purchased
- Currency – ISO 4217 currency code
If the purchase event currency is not USD, MessageGears converts the calculated amount to USD using the exchange rate at the time the purchase occurred. All revenue metrics in the Conversions dashboard are reported in USD to ensure consistent comparison across campaigns, channels, and regions.
Notifications tab
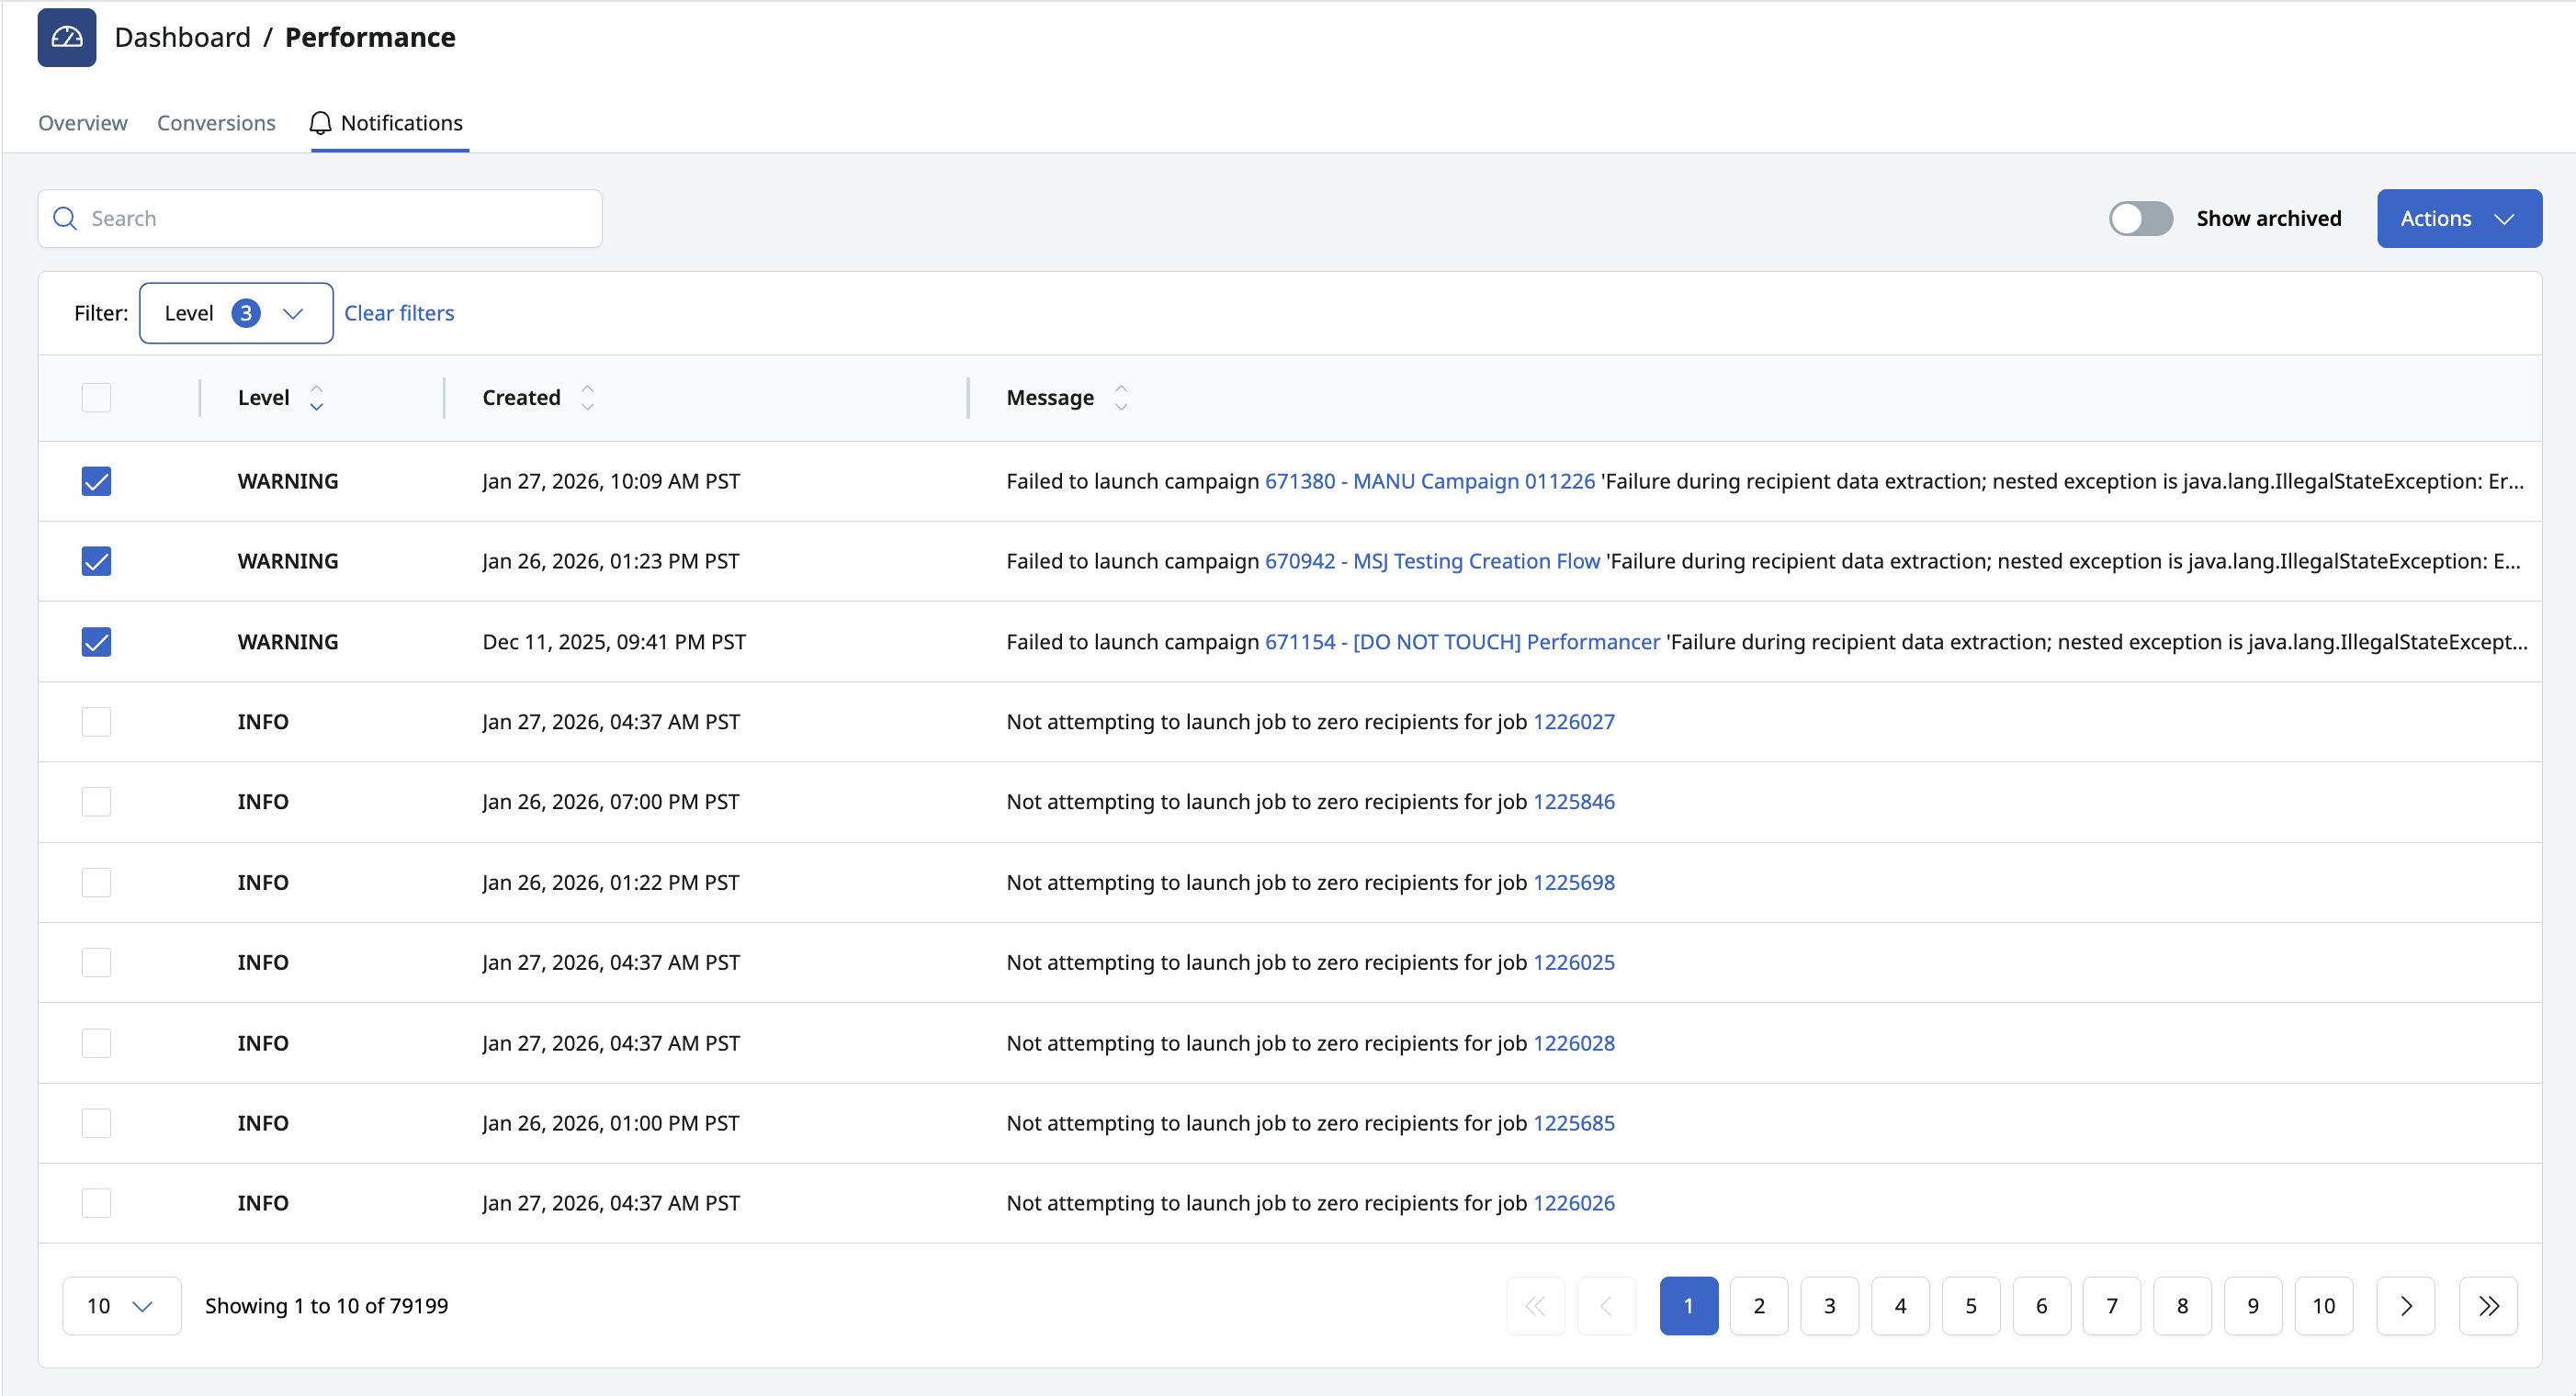
The Notifications tab provides a centralized log of system-generated messages related to campaign execution and platform activity. It's designed to help teams quickly identify errors, warnings, and informational events that may require attention or follow-up.
What you'll find in notifications
The Notifications table lists system messages generated by Accelerator, including:
- Campaign scheduling issues
- Execution or processing errors
- Warnings that may impact delivery
- Informational messages about system activity
Each row represents a single notification event and includes when it occurred and what action or asset it relates to.
Notification levels
Notifications are categorized by level, making it easier to prioritize issues:
- Error – A failure that prevented an action from completing (for example, a campaign that could not be scheduled)
- Warning – A potential issue that may affect behavior but did not stop execution
- Info – Informational messages related to system activity
You can filter the table by one or more levels to focus on the most relevant messages.
Notification details
Each notification includes the following information:
- Level – Indicates the severity of the notification (Error, Warning, or Info)
- Created – Date and time the notification was generated
- Message – A description of the event, often including links to related campaigns or assets
Selecting linked campaign names allows you to quickly navigate to the relevant asset for investigation or resolution.